
Miami | Bogotá | Santo Domingo | Santiago de Chile

Technology for business management

Miami | Bogotá | Santo Domingo | Santiago de Chile

Technology for business management

Measurable Change Management: ERP Adoption with Real KPIs

Measurable change management turns ERP adoption into a manageable process. Learn how to track resistance, engagement, and ROI with Power BI, Viva Insights, and a 30/60/90-day plan.
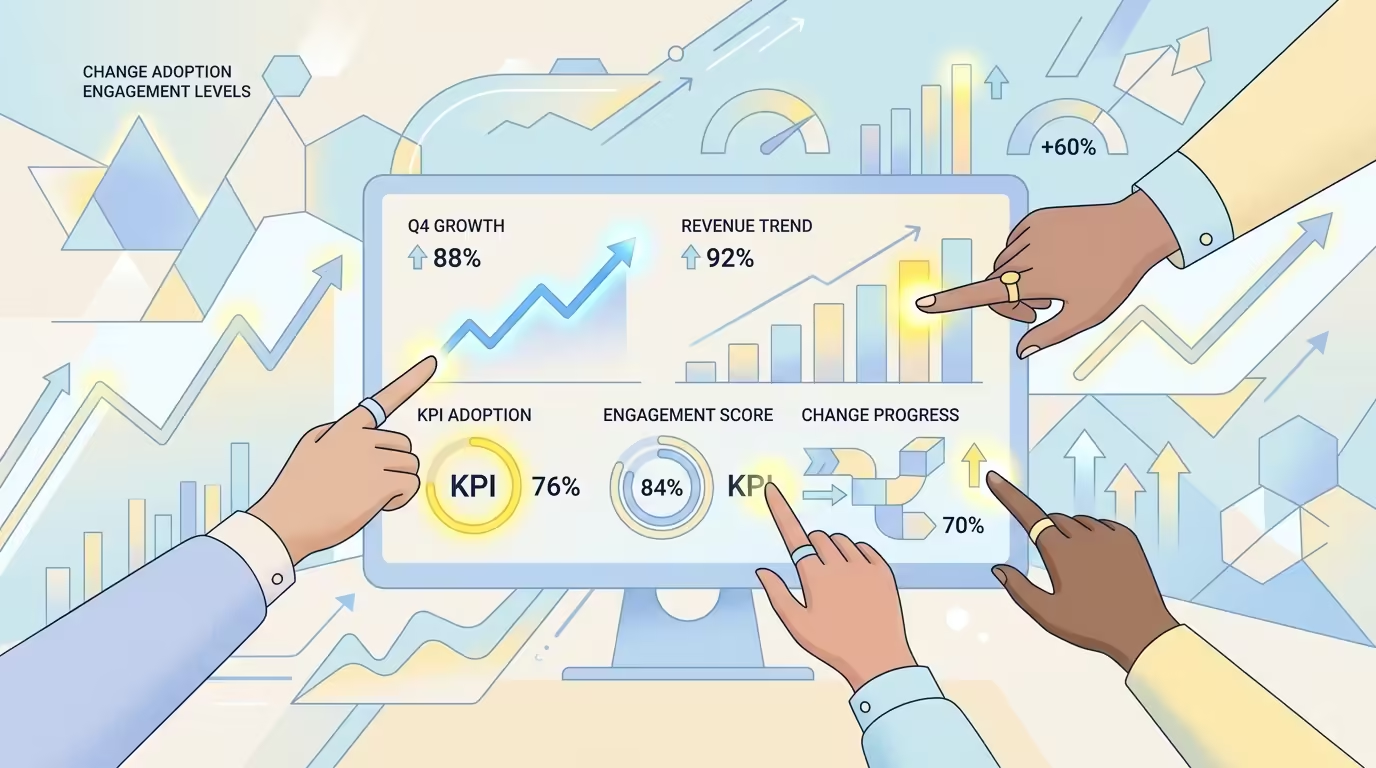
Equipo observando métricas de adopción de ERP con gráficos ascendentes y datos de change management en pantalla digital.

The ERP is configured. Go-live was three months ago. And yet, half the team is still opening Excel to do what the system should handle on its own. That scenario is not a technical problem: it is a change management problem. And the difference between solving it or letting it fester lies in whether you have real metrics or just gut feelings.

Team observing ERP adoption metrics with rising charts and change management data on a digital screen.

Many ERP projects treat organizational change as a task list: communicate the launch, run a few training sessions, publish a manual. They check it off as done and move on. The problem is that none of those activities measure whether the change actually happened.

Measuring adoption requires moving from tracking outputs —emails sent, sessions held— to measuring outcomes: adoption rates, competency levels, time to productivity. That distinction seems obvious on paper, but in practice most teams report the former because it is easy to count.

According to Prosci’s Unlocking ERP Implementations study (2025), human factors matter six times more than technical factors when it comes to improving ERP outcomes. Six times. And yet, the change management budget in most projects does not exceed 10% of the total. That is where the gap lies.

Without a baseline, any improvement is invisible and any setback goes unnoticed until the damage is already done. That is why tracking adoption KPIs —also known as OCM (Organizational Change Management)— is essential for the success of any implementation.

The change resistance metrics that actually matter

Change resistance is not visible — it is measurable. There are quantifiable signals that appear before anyone tells you in a meeting that “the system doesn’t work.” Identifying them early is the difference between a quick intervention and a costly redesign.

Active adoption rate (User Adoption Rate)

This indicates the percentage of employees who are actively using the new tool or process. It is the most direct change management metric: it reflects real behavioral change, not just deployment. It is calculated by dividing active users by the total target user base, multiplied by 100.

A low percentage does not always indicate resistance; it may point to communication or workflow gaps. Segmenting by department or hierarchical level reveals which groups are lagging and who can act as internal ambassadors.

Rollback or rework rate

This reflects how often employees revert to previous processes or undo implemented changes. In a Dynamics 365 Finance project, it translates into how many journal entries are still being made outside the system or how many approvals are managed by email instead of through a workflow.

If that number does not drop week over week, there is an engagement problem that no technical support ticket is going to solve.

Time to sustained adoption (Time-to-Value)

This measures how quickly employees move from launch to consistent, confident use. It is calculated by measuring the days between deployment and the moment a defined adoption threshold is reached —for example, 80%.

If the first wave takes 45 days to reach that threshold, you have a real reference point for planning subsequent waves and adjusting training before expanding.

The real cost of low adoption: an ROI model for your CFO

Justifying the investment in change management to a CFO requires numbers, not qualitative arguments. Here is a simple model based on industry benchmarks.

Base scenario: manufacturing company in LATAM, 80 Dynamics 365 users, average monthly salary equivalent to 1,200 USD per user.

  • Productivity drop during the transition: ERP implementations generate productivity drops of between 10% and 20% while users learn the new processes, according to 2025 benchmarks. With 80 users and an average 15% drop over 60 days, the cost is approximately 28,800 USD in unproductive hours.
  • Workarounds and unplanned support: organizations without structured hypercare support in the first 60–90 days face emergency consulting costs of between 15,000 and 40,000 USD, according to 2025 industry data.
  • Cost of a structured CM plan: a well-executed change management plan —with an adoption dashboard, segmented training, and an active executive sponsor— typically represents between 8% and 12% of the total project budget. On a 200,000 USD project, that is between 16,000 and 24,000 USD.

Conclusion for the CFO: investing in measurable change management costs less than the first month of low adoption. According to Prosci, high adoption accelerates ERP benefit realization because users integrate the system into their daily operations more quickly. The average ROI of an ERP project is 52% when adoption is high; it drops dramatically when it is not.

Tools to build your adoption dashboard in the Microsoft ecosystem

The adoption dashboard we promise at go-live is not an abstract concept. It is built with tools you already have if you work with Dynamics 365.

Power BI embedded in Dynamics 365

Power BI integrates natively with Dynamics 365 Finance & Operations, allowing you to create dashboards embedded directly in the ERP workspaces. You can visualize daily login rate, transaction volume per user, and the percentage of processes completed inside the system versus outside it.

Microsoft Viva Insights

Viva Insights provides integrated adoption dashboards that measure collaboration patterns, usage frequency, and engagement signals at the team level, with aggregated and anonymized data to protect privacy. Managers can detect collaboration silos and disconnected departments without accessing individual data.

Since 2025, Viva Insights includes integration with Copilot for Microsoft 365, enabling natural language queries about adoption patterns: “which teams have the highest workload outside the system?” is a valid query.

Microsoft Forms for readiness surveys

The five-question readiness surveys mentioned in the 30/60/90 plan are implemented directly in Microsoft Forms, with distribution via Teams and automatic analysis in Excel or Power BI. No additional cost, no friction from external tools.

The 5 KPIs of the go-live dashboard

  • Daily login rate: % of active users out of the total assigned.
  • Training completion rate: by role and by department.
  • Rollback rate: transactions or processes executed outside the system.
  • Support tickets per user: an inverse indicator of competency.
  • Readiness score: result of the 5-question survey, segmented by area.

The 30/60/90-day plan: from change resistance to measurable adoption

An effective change management plan is not a launch communication plus a Q&A session. It is a roadmap with measurable milestones, clear owners, and decision points where you can pivot if the data calls for it.

First 30 days: diagnosis and baseline

Before go-live —or in the first week after it— establish the baseline. Measure:

  • Initial adoption rate and average login time.
  • Percentage of users who complete onboarding.
  • Competency level by role.
  • Readiness score (5-question survey in Microsoft Forms).

The survey will tell you who is ready, who has doubts, and who is already in active resistance mode. Include these KPIs in leadership updates from the first sprint. The executive sponsor needs to see the data, not just hear that things are “going well.”

The ADKAR model (Awareness, Desire, Knowledge, Ability, Reinforcement) is the most widely used methodological reference in this phase: each KPI in the dashboard maps to one of its five elements, making it easier to diagnose where the real blockage is.

Days 31 to 60: segmented intervention

With the baseline in hand, segment. Not all departments have the same resistance profile.

Finance may have high technical adoption but low confidence in reports. Operations may have the opposite problem. Adoption data segmented by area reveals which groups are lagging and who can act as ambassadors.

In this phase, change management work is surgical:

  • Role-specific reinforcement sessions.
  • Coaching for line managers with ready-to-use conversation guides.
  • Personalized communication for groups with the highest rollback rate.
  • Activation of the executive sponsor in departments with low engagement.

Investing in manager enablement during this phase is a critical lever. A manager who does not know how to read their team’s adoption dashboard cannot intervene in time.

Days 61 to 90: consolidation and gap closure

The goal in the third month is to bring active adoption above 75%–85% and reduce the rollback rate to below 10%. If a specific group remains below the threshold, the problem is no longer about training: it is about executive sponsorship or process redesign.

According to Prosci research, stakeholder commitment and transparent communication plans are crucial elements in this phase. An executive sponsor who communicates real results —not just motivational messages— has a direct impact on the adoption rate of the teams reporting to them.

This is also the time to activate the hypercare period: intensive post-go-live support that prevents the accumulation of errors and the silent abandonment of the system. Organizations without structured hypercare in the first 60–90 days face avoidable emergency consulting costs.

Change resistance: the patterns we see most often in LATAM

Different team members showing change resistance patterns in an ERP implementation with visual barriers.

Change resistance in ERP projects in LATAM has its own patterns. It is not just fear of the new: it is distrust of data, an entrenched workaround culture, and, frequently, a gap between what the system does and how the local business process is designed.

Resistance is a natural human response. Acknowledging that is not an excuse for not managing it: it is the starting point for designing interventions that work with human nature, not against it. The Kotter 8-step framework and Prosci’s ADKAR model are the two most cited organizational change management methodologies for structuring those interventions.

In Dynamics 365 projects in manufacturing and retail, the three most frequent patterns are:

  • Deliberate incorrect data: users who enter erroneous data so the system “doesn’t give them extra work.”
  • Process exceptions: managers who request exceptions to the standard process for their teams.
  • Undocumented parallel integrations: IT teams that maintain legacy connections because “the new system hasn’t been fully tested yet.”

All three are measurable signals. All three have a solution if detected before day 60.

How KCP Dynamics applies this framework in real projects

At KCP Dynamics we do not deliver a configured ERP and walk away. Measurable change management is part of the scope from the very first project meeting.

That means the client has, from go-live:

  • An adoption dashboard in Power BI with the 5 KPIs described above.
  • A 30/60/90 plan with milestones, owners, and decision points.
  • An escalation protocol when an indicator falls below the threshold.
  • An executive sponsor activated from day 1, not from day 61.

What differentiates this approach is that the metrics are not decorative. Every two weeks there is an adoption review where the data drives decisions: if the rollback rate rises, the training plan is adjusted. If engagement in a department drops, the sponsor for that area is activated. If time-to-value exceeds the benchmark, the process design is reviewed, not just the communication.

If your ERP project has been in production for more than 60 days and the user adoption rate has not exceeded 60%, the problem is no longer technical. Let’s talk about the real numbers before the gap becomes entrenched.

Frequently asked questions about change management and ERP adoption

When should I start the change management plan in an ERP project?

Before go-live, not after. The most common mistake is treating change management as a post-launch activity. The readiness diagnosis, identification of key stakeholders, and definition of adoption KPIs must all be ready before the first user enters the system. If you start when active resistance is already present, the cost of intervention multiplies.

What active adoption rate is acceptable at 90 days?

The usual benchmark in enterprise ERP projects is to reach between 75% and 85% active adoption at 90 days post go-live. Below 60% at 60 days is a warning signal that requires immediate intervention. The exact threshold depends on the sector and the scope of the deployment, but what matters is having defined it before launch.

How is change resistance measured objectively?

Through behavioral indicators: rollback rate to previous processes, system usage frequency, training completion percentage, number of support tickets per user, and readiness survey results. Resistance is not measured by asking whether someone “supports the change”: it is measured by observing what they do with the system every day.

Which OCM methodology is most suitable for Dynamics 365 implementations?

ADKAR (Prosci) is the most widely used methodology in Microsoft projects because it maps directly to the Dynamics 365 deployment phases and allows measurable KPIs to be assigned to each stage of the change. Kotter is complementary for managing executive sponsorship and creating urgency at the start of the project. At KCP Dynamics we combine both frameworks depending on the client’s maturity profile.

Does change management apply the same way in manufacturing as in financial services?

The framework is the same, but the resistance patterns and priority KPIs vary. In manufacturing, the focus tends to be on the adoption of operational processes and traceability. In financial services, the weight falls on data trust and regulatory compliance. In LATAM, local process and organizational culture particularities must also be considered, as they directly affect the design of the communication and training plan.

Person completing training on a tablet with engagement indicators and visual progress metrics for adoption.

Sources

Sources

Otros artículos que podrían interesarte

Últimos artículos publicados